Nodes are not ready
Nodes are not fully ready: That’s why those are SchedulingDisabled (Cordoned)

Root cause: They were drained before shutdown

Need to uncordon both:
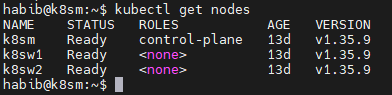

Nodes are not ready
Nodes are not fully ready: That’s why those are SchedulingDisabled (Cordoned)
Root cause: They were drained before shutdown
Need to uncordon both:
top, htop, or mpstatuptime or check the output of top (the three numbers at the top-right).nproc).top or ps -eo pid,ppid,cmd,%mem,%cpu --sort=-%cpu.free -h or vmstat -s.free -h or swapon -s).top or ps -eo pid,ppid,cmd,%mem --sort=-%mem.df -h to check disk usage across filesystems.df -i to check inode utilization.iostat, iotop, or dstat./var/log/ for any disk-related errors.iftop, ip -s link, or netstat.ss or netstat to check open connections and ports.ping, traceroute, or mtr.vnstat, iftop, or nload.journalctl or /var/log/syslog (for system-wide events).dmesg or journalctl -k to check for hardware errors or warnings.uptime command provides server uptime and load averages.sar or atop.systemctl status <service> or service <service> status.ps aux | grep Z to list zombie processes.who, w, or last./var/log/secure or /var/log/auth.log.iptables -L or ufw status.ss -tuln or netstat -tuln.sensors (part of lm-sensors package).mdadm or vendor tools if RAID is configured.crontab -l or check /etc/crontab./var/log/syslog for cron-related logs.top, df, iostat, and log parsing can provide quick insights.By periodically reviewing these parameters, you can ensure the Linux server’s health and address potential issues proactively.
“journalctl” – is a command-line tool in Linux used to query and view logs managed by the systemd-journald service, which is part of the systemd system and service manager. journalctl allows users to access log data from various sources in a consolidated, searchable format, covering everything from kernel and system logs to application logs for services that run on systemd.
Here’s a quick overview of how to use journalctl:
1 .View All Logs:
journalctl
2. View Most Recent Logs:
journalctl -r
3 .Follow Logs in Real-Time (similar to tail -f):
journalctl -f
4. Specify a Service:
journalctl -u [service-name]
5. Filter by Time:
journalctl –since “YYYY-MM-DD HH:MM:SS” –until “YYYY-MM-DD HH:MM:SS”
journalctl –since “1 hour ago”
6. Filter by Priority:
journalctl -p [priority]
7. View Kernel Messages:
journalctl -k
8. Advanced Filtering:
journalctl -u nginx –since “2024-10-01” –until “2024-10-31” -p warning