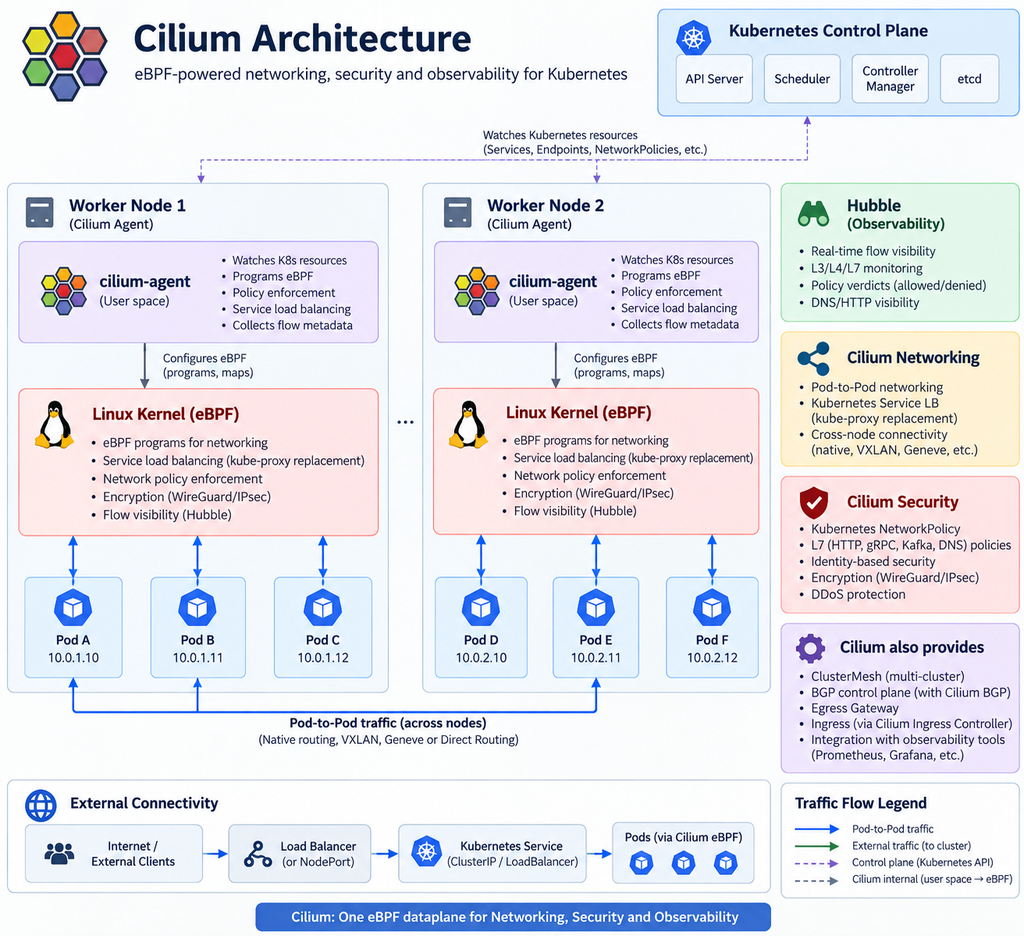
Cilium – CNI for Kubernetes

What is Cilium?
Cilium is an open-source CNI (Container Network Interface) for Kubernetes. It uses Linux eBPF technology to provide high-performance networking, security, load balancing, and observability.

Where is it used?
Cilium is commonly used in Kubernetes environments for Pod-to-Pod networking, NetworkPolicy enforcement, Service load balancing, multi-cluster connectivity, and network monitoring. It is especially useful in large-scale cloud-native environments where performance, security, and visibility are important.

Key features: eBPF-based networking, L3/L4/L7 security policies, kube-proxy replacement, encryption with WireGuard/IPsec, and network observability through Hubble.

Alternatives: Calico is a popular feature-rich CNI with strong network-policy capabilities; Flannel is a simpler option mainly focused on Pod networking; Antrea is a Kubernetes-native networking and security solution based on Open vSwitch; and Kube-router provides networking and policy with a relatively lightweight architecture.

In short:
Cilium = Kubernetes networking + security + observability, powered by eBPF.

Sunday Kubernetes learning plan

Based on the LFS258 topics, here is a 12-week Sunday Kubernetes Fundamentals learning plan. I’ve arranged it so each week builds on the previous one and includes theory, commands, a diagram topic, and a practical lab.

WeekMain TopicKey Things to LearnCommands / Lab Focus
1Kubernetes FoundationsContainers vs Kubernetes, cluster concepts, control plane vs worker nodeskubectl version, kubectl cluster-info, kubectl get nodes
2Kubernetes ArchitectureAPI Server, Scheduler, Controller Manager, etcd, kubelet, kube-proxykubectl get pods -A, kubectl describe node
3Cluster Installationkubeadm, kubelet, kubectl, container runtime, cluster bootstrapkubeadm init, kubeadm join, kubectl get nodes
4Pods & API ObjectsPods, YAML, namespaces, labels, annotationskubectl run, kubectl get pod, kubectl describe, kubectl apply -f
5Deployments & WorkloadsReplicaSets, Deployments, scaling, rolling updates, rollbackkubectl create deployment, kubectl scale, kubectl rollout
6Services & NetworkingClusterIP, NodePort, service discovery, DNS, pod networkingkubectl expose, kubectl get svc, kubectl get endpoints
7Ingress & GatewayIngress Controller, HTTP routing, Gateway APICreate an Ingress and route traffic to two Services
8Kubernetes StorageVolumes, PV, PVC, StorageClass, CSI, Ceph integrationkubectl get pv,pvc,sc, create PVC and mount into a Pod
9Helm & KustomizePackage management, Helm charts, templating, overlayshelm install, helm list, helm upgrade, kubectl apply -k
10Scheduling & SecurityScheduler, affinity, taints/tolerations, RBAC, ServiceAccountskubectl taint, kubectl auth can-i, kubectl create role
11Troubleshooting & LoggingLogs, events, failed Pods, networking, resource problemskubectl logs, kubectl events, kubectl exec, kubectl top
12HA + CKA ReviewHA control plane, etcd, CRDs, backup/recovery, exam-style troubleshootingMixed troubleshooting lab + CKA-style exercises

Week 1 — Kubernetes Foundations

Start with the overall picture:

Application → Container → Pod → Worker Node → Kubernetes Cluster

Cover why Kubernetes exists, what problems it solves, Kubernetes vs Docker/Podman, clusters, nodes, Pods, and the basic declarative model.

Practice:

kubectl version
kubectl cluster-info
kubectl get nodes
kubectl get nodes -o wide
kubectl get pods -A

Diagram: Kubernetes high-level architecture.

Lab: Connect kubectl to a cluster and identify the control-plane and worker nodes.


Week 2 — Kubernetes Architecture

Study the components in more detail:

              Kubernetes Cluster

          +----------------------+
          |    Control Plane     |
          |----------------------|
          | kube-apiserver       |
          | scheduler            |
          | controller-manager   |
          | etcd                 |
          +----------+-----------+
                     |
        -----------------------------
        |                           |
+-------v-------+           +-------v-------+
| Worker Node 1 |           | Worker Node 2 |
|---------------|           |---------------|
| kubelet       |           | kubelet       |
| kube-proxy    |           | kube-proxy    |
| containerd    |           | containerd    |
| Pods          |           | Pods          |
+---------------+           +---------------+

Useful commands:

kubectl get pods -n kube-system
kubectl describe node <node-name>
kubectl get componentstatuses
kubectl get --raw='/readyz?verbose'

Lab: Identify which Kubernetes component performs scheduling, stores cluster state, communicates with nodes, and maintains desired state.


Week 3 — Building a Cluster

Learn how the pieces are installed:

Linux → containerd → kubelet → kubeadm → Kubernetes

Core commands:

sudo kubeadm init

Configure kubectl:

mkdir -p $HOME/.kube
sudo cp /etc/kubernetes/admin.conf $HOME/.kube/config
sudo chown $(id -u):$(id -g) $HOME/.kube/config

Worker:

sudo kubeadm join <control-plane-ip>:6443 \
  --token <token> \
  --discovery-token-ca-cert-hash sha256:<hash>

Lab: Build a small cluster or walk through a kubeadm deployment.


Week 4 — Pods and Kubernetes API Objects

Learn the most important Kubernetes object first: the Pod.

Example:

apiVersion: v1
kind: Pod
metadata:
  name: nginx
  labels:
    app: web
spec:
  containers:
    - name: nginx
      image: nginx

Run:

kubectl apply -f nginx.yaml
kubectl get pods
kubectl get pods -o wide
kubectl describe pod nginx
kubectl logs nginx

Also cover:

kubectl get namespaces
kubectl get pods -n kube-system
kubectl get pods --show-labels

Diagram: Pod → Container relationship.

Lab: Create two Pods using YAML and labels.


Week 5 — Deployments, ReplicaSets and Workloads

The relationship to understand is:

Deployment
    |
    v
ReplicaSet
    |
    v
+-----+ +-----+ +-----+
| Pod | | Pod | | Pod |
+-----+ +-----+ +-----+

Commands:

kubectl create deployment nginx --image=nginx
kubectl get deployments
kubectl get rs
kubectl get pods

Scale:

kubectl scale deployment nginx --replicas=4

Upgrade:

kubectl set image deployment/nginx nginx=nginx:1.27

Check:

kubectl rollout status deployment/nginx
kubectl rollout history deployment/nginx

Rollback:

kubectl rollout undo deployment/nginx

Lab: Deploy nginx, scale it, upgrade it, then roll it back.


Week 6 — Kubernetes Networking & Services

This is one of the most important Kubernetes topics.

Understand:

          Service
       10.96.10.20
            |
    -----------------
    |       |       |
   Pod     Pod     Pod
10.1.1.2 10.1.2.3 10.1.3.4

Study:

Pod IP → Service → ClusterIP → NodePort → external access

Commands:

kubectl expose deployment nginx \
  --port=80 \
  --type=ClusterIP

kubectl get svc
kubectl describe svc nginx
kubectl get endpoints

NodePort:

kubectl expose deployment nginx \
  --name=nginx-nodeport \
  --port=80 \
  --type=NodePort

Lab: Access an application first through Pod IP, then ClusterIP, then NodePort.


Week 7 — Ingress and Gateway API

Architecture:

Internet
   |
   v
Ingress / Gateway
   |
   +----------------+
   |                |
   v                v
Service A        Service B
   |                |
 Pods             Pods

Learn host/path routing such as:

example.com/app1 → service-app1
example.com/app2 → service-app2

Commands:

kubectl get ingress
kubectl describe ingress

Lab: Deploy two applications and route /app1 and /app2 to different Services.


Week 8 — Storage, PV, PVC, CSI and Ceph

This week connects directly to the Ceph diagrams we discussed.

Understand:

Application Pod
      |
      v
     PVC
      |
      v
      PV
      |
      v
 StorageClass
      |
      v
  CSI Driver
      |
      v
     Ceph

Commands:

kubectl get pv
kubectl get pvc
kubectl get storageclass
kubectl describe pvc <pvc-name>

Example PVC:

apiVersion: v1
kind: PersistentVolumeClaim
metadata:
  name: app-data
spec:
  accessModes:
    - ReadWriteOnce
  resources:
    requests:
      storage: 5Gi

Lab: Create a PVC, attach it to a Pod, write data, delete/recreate the Pod, and verify that the data remains.


Week 9 — Helm & Kustomize

Learn why manually maintaining dozens of YAML files becomes difficult.

Helm:

helm repo add bitnami https://charts.bitnami.com/bitnami
helm repo update

helm install my-nginx bitnami/nginx
helm list
helm upgrade my-nginx bitnami/nginx
helm uninstall my-nginx

Kustomize:

kubectl apply -k .

Concept:

Base YAML
   |
   +---- Dev Overlay
   |
   +---- Test Overlay
   |
   +---- Production Overlay

Lab: Install an application with Helm and modify another application using Kustomize.


Week 10 — Scheduling and Security

Scheduling:

Pod
 |
Scheduler
 |
 +---- Node A
 +---- Node B
 +---- Node C

Study:

requests/limits, nodeSelector, affinity, anti-affinity, taints and tolerations.

Commands:

kubectl describe node
kubectl get pods -o wide

kubectl taint nodes worker1 dedicated=test:NoSchedule

Security topics:

User → Role → RoleBinding → Resource

Commands:

kubectl auth can-i get pods
kubectl auth can-i delete pods

kubectl create serviceaccount app-user

Lab: Restrict a ServiceAccount so it can read Pods but cannot delete them.


Week 11 — Troubleshooting

This should be one of the most practical sessions.

Use a troubleshooting sequence:

Application issue
       |
       v
kubectl get pods
       |
       v
kubectl describe
       |
       v
kubectl logs
       |
       v
Events / Service / DNS
       |
       v
Node / kubelet

Core commands:

kubectl get pods -A
kubectl get events --sort-by=.metadata.creationTimestamp

kubectl describe pod <pod>
kubectl logs <pod>
kubectl logs <pod> --previous

kubectl exec -it <pod> -- /bin/sh

kubectl top pods
kubectl top nodes

Also practice:

journalctl -u kubelet

Lab: Intentionally create:

  • Wrong container image
  • Wrong Service selector
  • Incorrect port
  • Failed readiness probe
  • Unschedulable Pod

Then diagnose each one.


Week 12 — High Availability + CKA Review

Finish with production Kubernetes architecture:

             Load Balancer
                  |
        ---------------------
        |         |         |
       CP1       CP2       CP3
        |         |         |
        ------- etcd -------
                  |
       ---------------------
       |         |         |
     Worker1   Worker2   Worker3

Study:

HA control plane, etcd backup/restore, CRDs, node maintenance, application recovery, cluster troubleshooting.

Useful operations:

kubectl cordon worker1
kubectl drain worker1 --ignore-daemonsets
kubectl uncordon worker1

Review:

kubectl get nodes
kubectl get pods -A
kubectl get svc
kubectl get ingress
kubectl get pv,pvc
kubectl get roles,rolebindings

Finish with a practical challenge: deploy an application with Deployment → Service → Ingress → PVC, intentionally introduce two faults, then troubleshoot them.

Recommended Sunday session structure

Since you already have a regular Kubernetes & Cloud Native learning session, a compact format can work well:

10 min — Concept → 5 min — Architecture diagram → 10 min — commands/demo → 5 min — troubleshooting/question

For deeper personal study, spend another 60–90 minutes during the week reproducing the lab yourself. The biggest improvement will come from typing the commands rather than only reading them.

After these 12 weeks, the natural next step is CKA-focused practice, especially timed exercises around troubleshooting, networking, storage, scheduling, RBAC, cluster maintenance, and kubectl speed.

CEPH – An open source distributed storage platform

Ceph is not an acronym, so there is no official expansion like “C.E.P.H.”

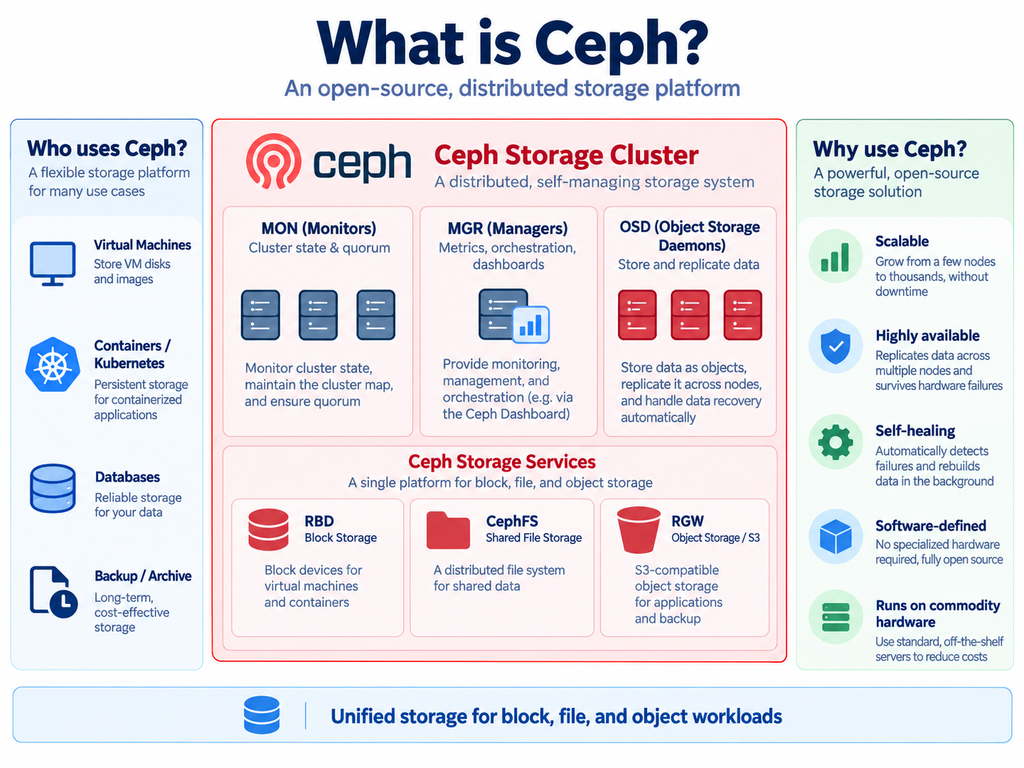
The name Ceph comes from “cephalopod”—animals such as an octopus or squid. The idea fits Ceph because it can spread and manage data across many storage nodes, somewhat like many arms working together.

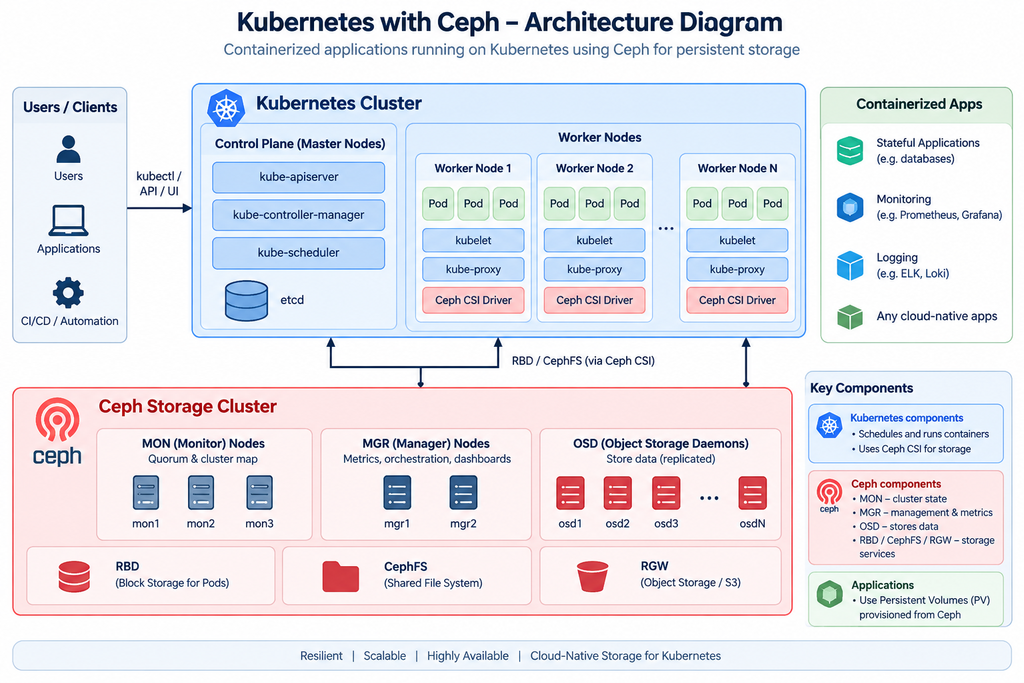
Kubernetes handles container orchestration, scheduling, networking, and application lifecycle management, while Ceph provides the storage layer. Ceph MON, MGR, and OSD components work together to maintain cluster health, manage the storage environment, replicate data, and provide resilient persistent storage to Kubernetes applications.

Ceph combines multiple storage servers into one distributed storage platform. It can provide RBD block storage for virtual machines and Kubernetes, CephFS for shared file storage, and RGW for S3-compatible object storage. Because data is distributed and replicated across multiple OSDs, Ceph can automatically recover from disk or server failures while keeping applications running.

Kubernetes and Ceph provide a scalable, highly available, cloud-native platform for running stateful applications such as databases, monitoring systems, logging platforms, and other enterprise workloads.

5G System (5GS) architecture

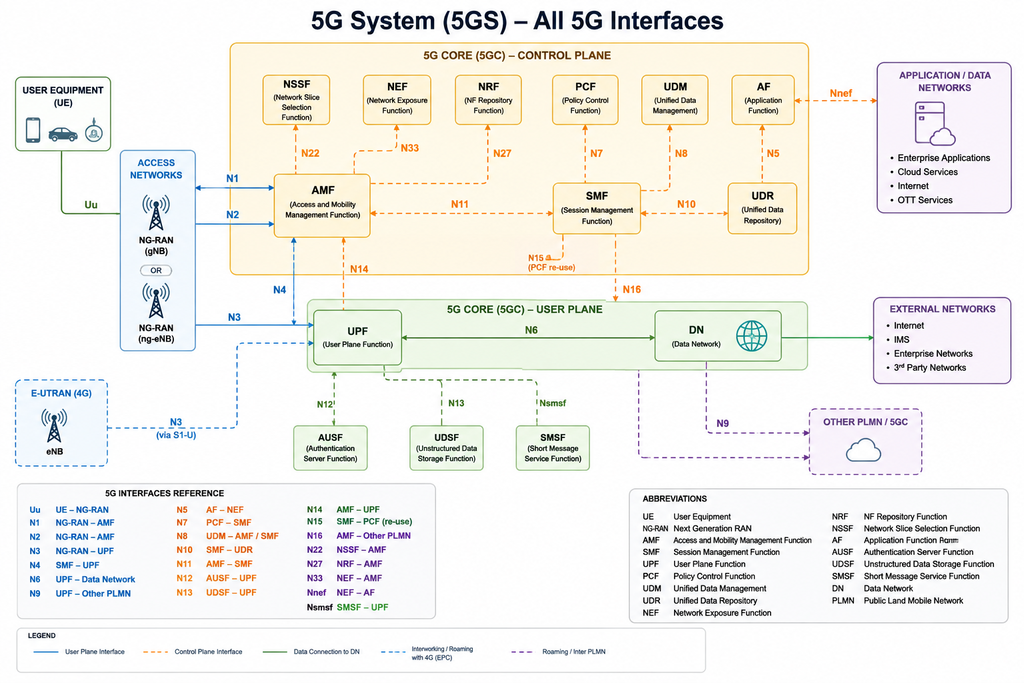
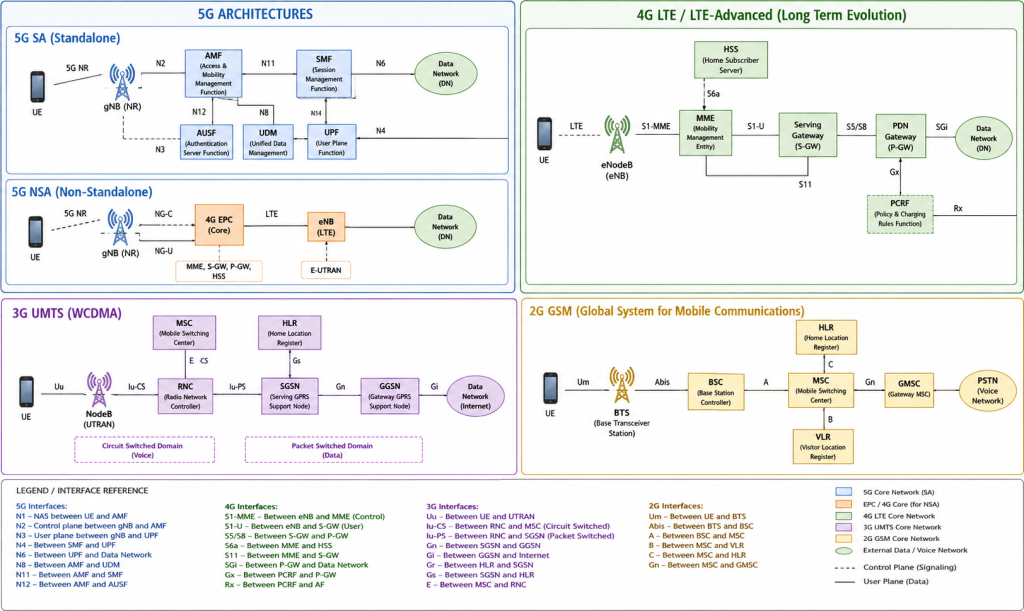
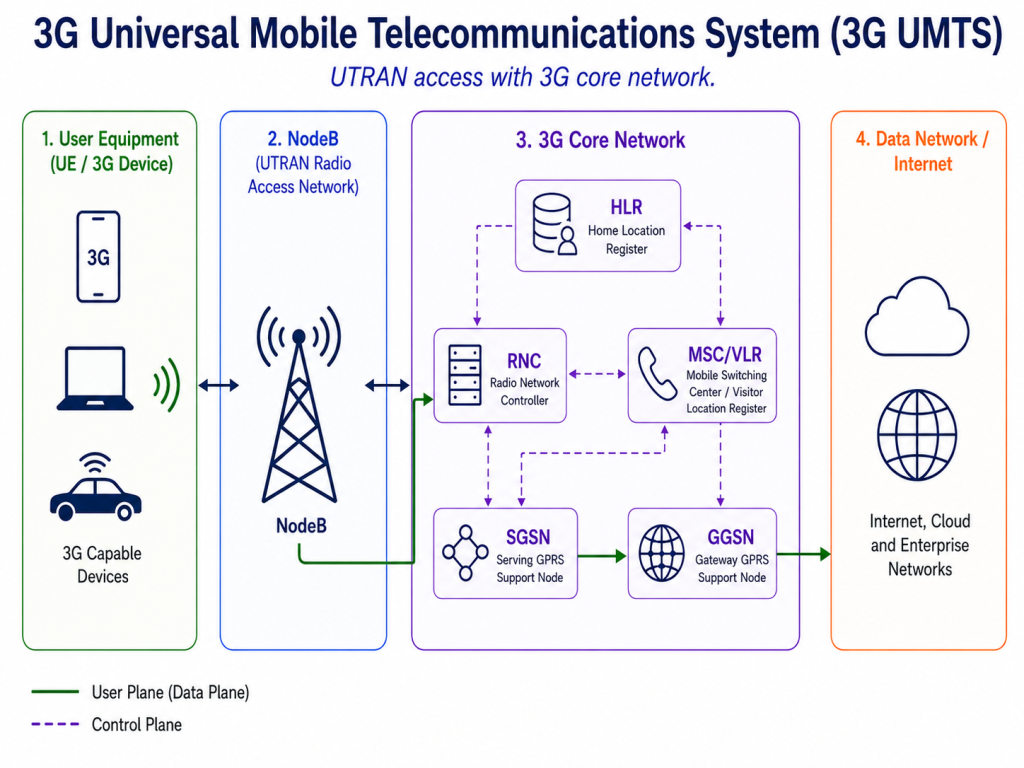
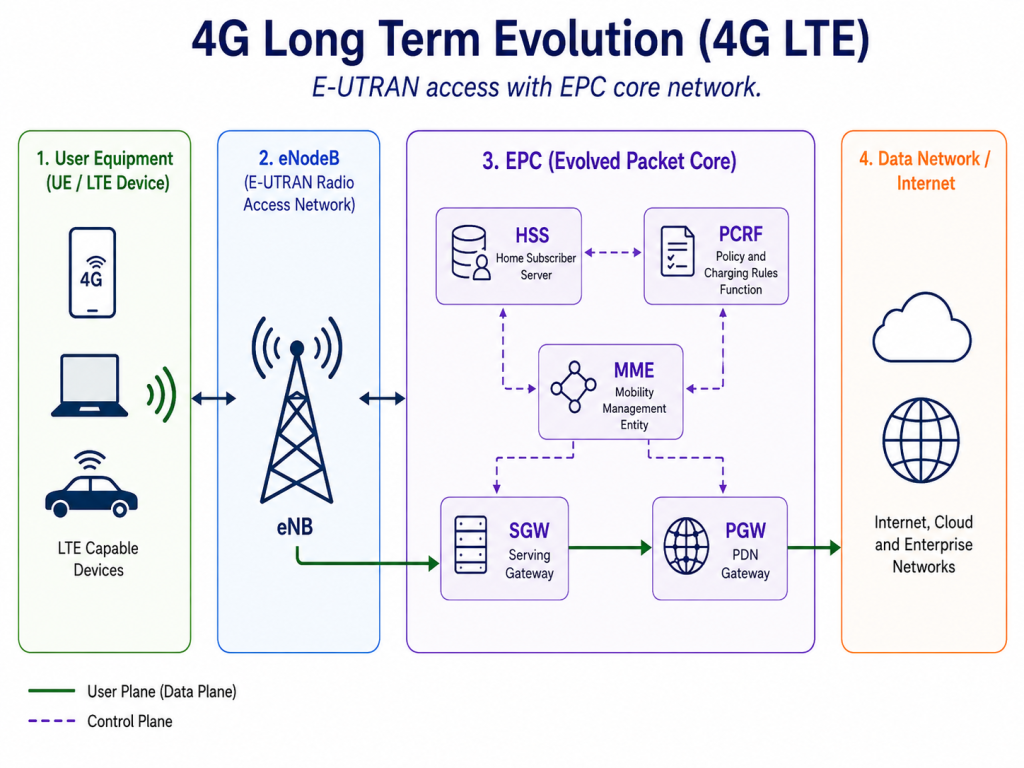
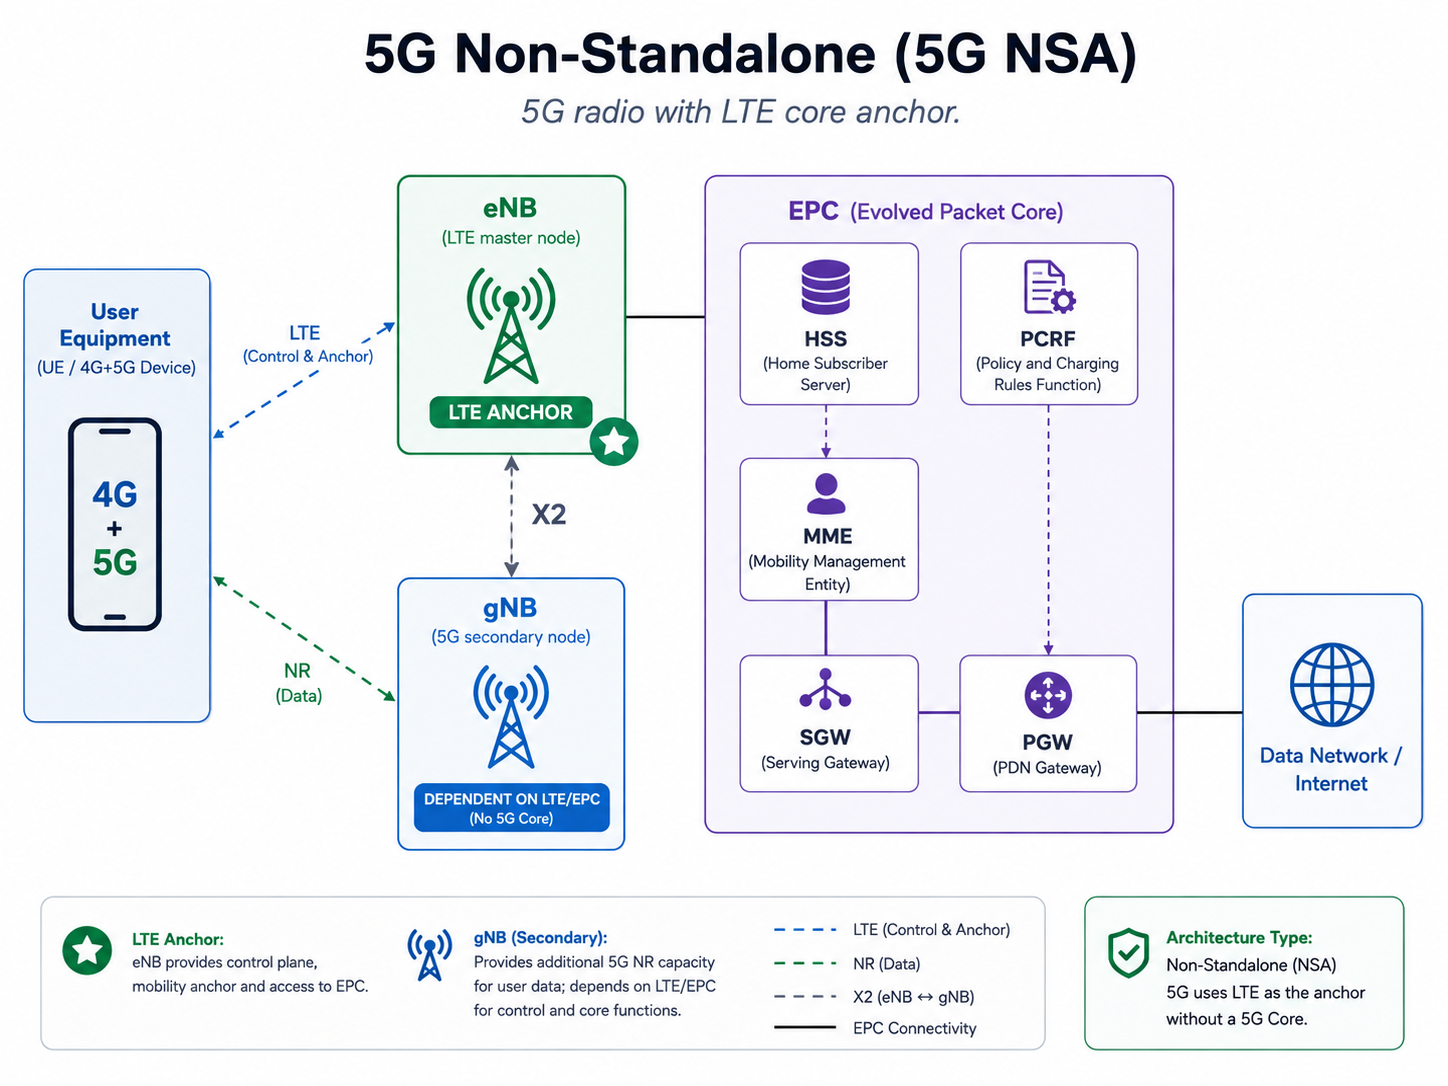
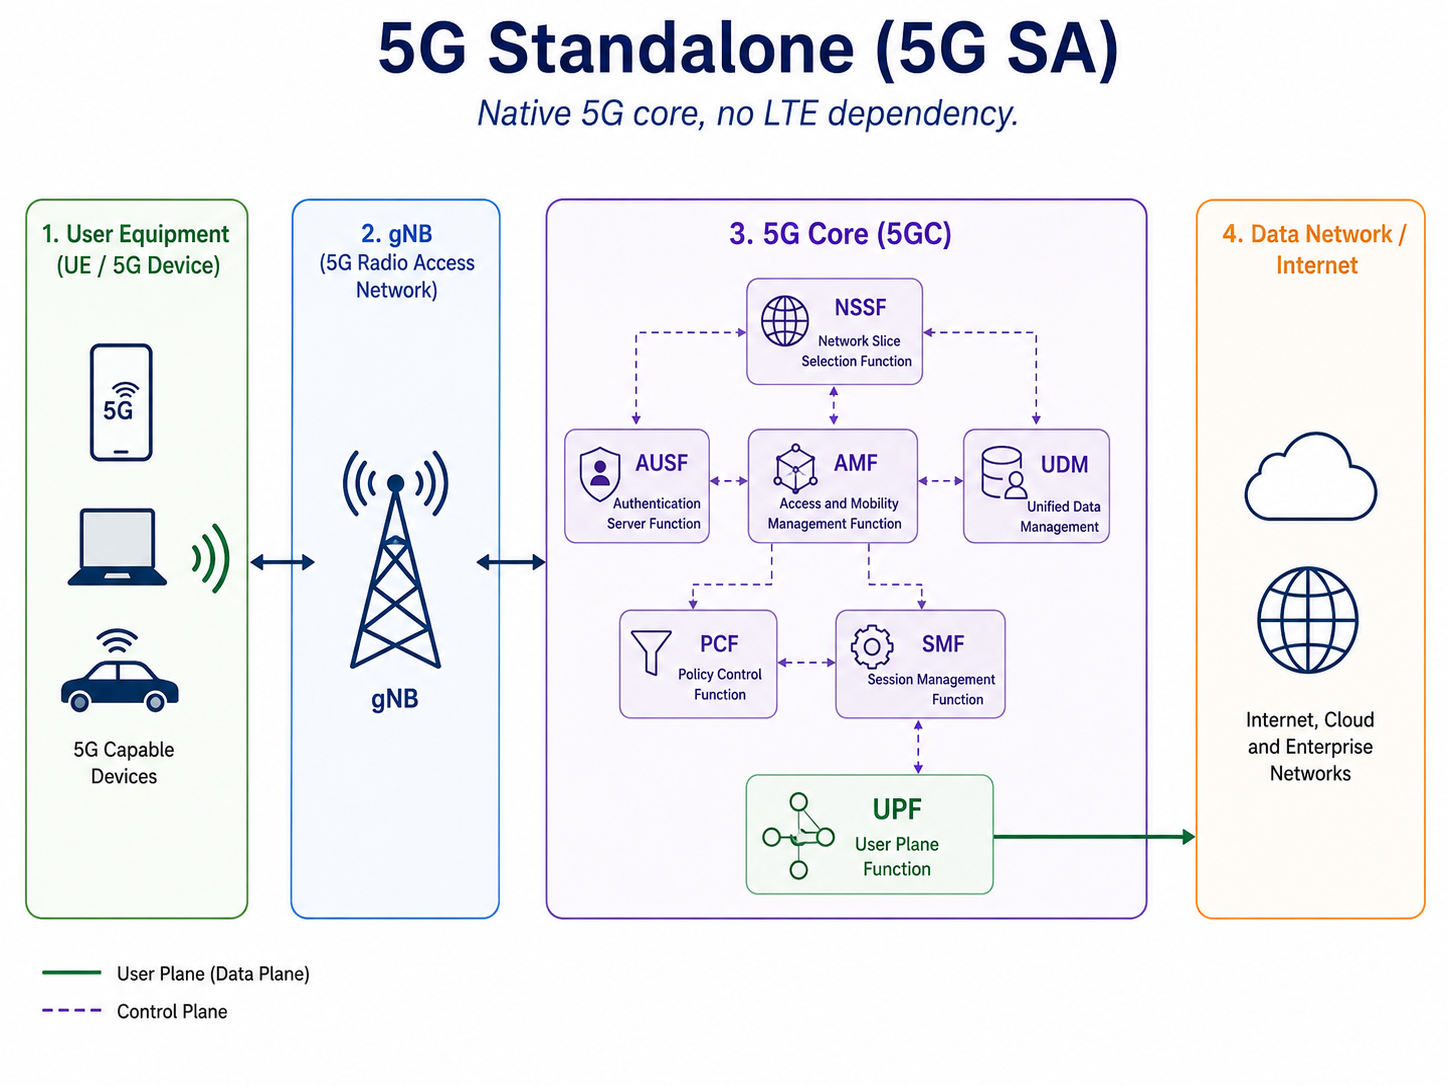
This diagram provides a high-level overview of the 5G System (5GS) architecture and its key interfaces. It shows how the User Equipment (UE), NG-RAN, 5G Core control-plane functions, user-plane functions, and external data networks communicate with each other.

The main interfaces include N1/N2 for UE and RAN signaling, N3/N4/N6 for user-plane traffic, and service-based interfaces such as N5, N7, N8, N10, N11, N22, N27, and N33 between 5G Core network functions. It also highlights 4G EPC interworking, roaming/inter-PLMN connectivity, and access to external application and data networks.

What and how to check any linux Server/Systems health

1. CPU Performance

  • Current Usage: top, htop, or mpstat
  • Load Average: uptime or check the output of top (the three numbers at the top-right).
  • Compare the load average to the number of CPU cores (nproc).
  • Processes: Monitor high-CPU-consuming processes using top or ps -eo pid,ppid,cmd,%mem,%cpu --sort=-%cpu.

2. Memory Usage

  • Total and Free Memory: free -h or vmstat -s.
  • Swap Usage: Check if swap space is being heavily used (free -h or swapon -s).
  • Processes Using Most Memory: top or ps -eo pid,ppid,cmd,%mem --sort=-%mem.

3. Disk Usage

  • Available Space: df -h to check disk usage across filesystems.
  • Inode Usage: df -i to check inode utilization.
  • Disk I/O: iostat, iotop, or dstat.
  • Error Messages: Review logs in /var/log/ for any disk-related errors.

4. Network Performance

  • Network Usage: iftop, ip -s link, or netstat.
  • Connections: ss or netstat to check open connections and ports.
  • Packet Loss/Latency: ping, traceroute, or mtr.
  • Bandwidth Monitoring: vnstat, iftop, or nload.

5. System Logs

  • General System Logs: journalctl or /var/log/syslog (for system-wide events).
  • Kernel Logs: dmesg or journalctl -k to check for hardware errors or warnings.

6. Uptime and System Load

  • Uptime: uptime command provides server uptime and load averages.
  • Load Analysis: Investigate load spikes with sar or atop.

7. Running Services and Processes

  • Service Status: systemctl status <service> or service <service> status.
  • Zombie/Unnecessary Processes: ps aux | grep Z to list zombie processes.

8. Security

  • Users Logged In: who, w, or last.
  • Unauthorized Logins: Review /var/log/secure or /var/log/auth.log.
  • Firewall Rules: iptables -L or ufw status.
  • Listening Ports: ss -tuln or netstat -tuln.

9. Hardware Health

  • Temperature and Fan Speed: sensors (part of lm-sensors package).
  • RAID Status: Check using mdadm or vendor tools if RAID is configured.

10. Scheduled Jobs

  • Cron Jobs: crontab -l or check /etc/crontab.
  • Failures: Examine /var/log/syslog for cron-related logs.

11. Backup Status

  • Backup Logs: Ensure regular backups are occurring as scheduled.
  • Verify Integrity: Test restore procedures periodically.

Automation Tools for Server Health Monitoring

  • Nagios, Zabbix, Prometheus, or Datadog for continuous monitoring.
  • Custom scripts combining commands like top, df, iostat, and log parsing can provide quick insights.

By periodically reviewing these parameters, you can ensure the Linux server’s health and address potential issues proactively.

What is SD-WAN and Benefits

SD-WAN (Software-Defined Wide Area Network) is a modern approach to managing and optimizing wide area networks (WANs), allowing businesses to securely and efficiently connect remote offices, data centers, and cloud resources over the internet. Unlike traditional WANs, which rely on expensive, static MPLS (Multiprotocol Label Switching) circuits or leased lines, SD-WAN uses software to dynamically manage the traffic across multiple types of network connections, such as broadband internet, 4G/5G, MPLS, and other network types.

How SD-WAN Works:

Centralized Control Plane:

    • SD-WAN is built around a centralized control plane that manages the entire network’s policies and traffic routing.
    • This control plane is typically hosted in the cloud or on-premises, and it communicates with SD-WAN devices (also called edge devices or appliances) at branch offices, data centers, or remote sites.
    • The centralized control allows for real-time traffic management and decision-making, optimizing network performance across different types of connections.

    Decentralized Data Plane:

      • The data plane is made up of SD-WAN devices located at the edge of the network, such as branch routers, and it handles actual data forwarding and traffic routing.
      • These edge devices are responsible for securely transmitting data between remote sites, data centers, and cloud applications, based on the policies set by the control plane.

      Traffic Management and Routing:

        • SD-WAN uses intelligent path selection to route traffic over the most appropriate and cost-effective path in real-time. It can choose from multiple links (e.g., MPLS, broadband, LTE) based on:
          • Performance metrics: latency, jitter, packet loss, etc.
          • Application requirements: certain applications might need high bandwidth or low latency.
          • Policy-driven decisions: predefined rules about how specific types of traffic should be prioritized (e.g., voice or video traffic).

        Application-Aware Routing:

          • SD-WAN can distinguish between different types of applications and automatically route traffic based on business priorities.
          • For example, it can prioritize VoIP or video conferencing traffic over general web browsing traffic to ensure high-quality performance for critical applications.
          • It can also dynamically adjust traffic routes based on network conditions to maintain application performance.

          Security:

            • SD-WAN often includes integrated security features such as:
              • Encryption: All traffic between SD-WAN devices is encrypted, ensuring secure communication over potentially untrusted public networks (e.g., the internet).
              • Firewalling: Built-in firewall capabilities can prevent unauthorized access and attacks.
              • VPN (Virtual Private Network): Secure site-to-site connections can be established, leveraging IPsec or SSL VPNs.
              • Zero Trust Security: Many SD-WAN solutions implement Zero Trust principles, ensuring that security policies are enforced across the network regardless of location.

            Cloud Integration:

              • SD-WAN is well-suited for cloud-first or hybrid IT environments because it allows direct and optimized access to cloud applications (e.g., SaaS, IaaS, PaaS) without routing traffic through centralized data centers.
              • This reduces latency, improves application performance, and enhances user experience by enabling direct internet breakout from remote sites to cloud services.

              Simplified Management:

                • SD-WAN solutions are often managed through a centralized, web-based portal, providing administrators with visibility into the entire network.
                • The portal allows for easy configuration, monitoring, troubleshooting, and reporting across all remote sites and cloud applications.
                • Many SD-WAN platforms offer automation, allowing for the rapid deployment of new branch sites or network changes without requiring manual configuration at each site.

                Key Benefits of SD-WAN:

                Cost Efficiency:

                  • By leveraging lower-cost internet connections (such as broadband or LTE) alongside or in place of expensive MPLS links, organizations can reduce their WAN costs significantly.

                  Improved Performance:

                    • SD-WAN can provide better application performance by selecting the best path based on real-time network conditions, reducing bottlenecks and improving the user experience.

                    Scalability:

                      • SD-WAN networks are easier to scale as businesses grow. New sites can be added quickly without the need for complex configurations or additional hardware.

                      Flexibility:

                        • SD-WAN can support multiple types of connections (e.g., MPLS, broadband, LTE, 5G), making it adaptable to a wide range of network environments.

                        Security:

                          • SD-WAN provides built-in encryption and secure connections, reducing the need for separate security appliances.

                          Cloud Optimization:

                            • SD-WAN helps businesses securely and efficiently connect to cloud applications and services without backhauling traffic through a central data center.

                            Centralized Control and Visibility:

                              • The centralized control plane gives IT teams a unified view of the network, simplifying management and troubleshooting.

                              Use Cases for SD-WAN:

                              1. Branch Office Connectivity: Connecting multiple branch offices securely and efficiently, with optimized performance for cloud applications.
                              2. Cloud Transformation: Ensuring seamless, secure access to cloud resources and applications for remote and branch locations.
                              3. Business Continuity: Using multiple network links to ensure high availability and failover in case of a link or site failure.
                              4. Remote Worker Access: Extending SD-WAN benefits to remote workers by securely connecting them to corporate applications via the internet.

                              Conclusion:

                              SD-WAN is revolutionizing the way organizations manage their WANs by using software to dynamically manage traffic, optimize application performance, and reduce costs. It provides a more flexible, secure, and efficient solution compared to traditional WAN architectures, making it particularly well-suited for modern cloud-driven, distributed enterprise environments.

                              Checking Linux Logs : All bout “journalctl”

                              “journalctl” – is a command-line tool in Linux used to query and view logs managed by the systemd-journald service, which is part of the systemd system and service manager. journalctl allows users to access log data from various sources in a consolidated, searchable format, covering everything from kernel and system logs to application logs for services that run on systemd.

                              Here’s a quick overview of how to use journalctl:

                              1 .View All Logs:

                              journalctl

                              2. View Most Recent Logs:

                              journalctl -r

                              3 .Follow Logs in Real-Time (similar to tail -f):

                              journalctl -f

                              4. Specify a Service:

                              journalctl -u [service-name]

                              5. Filter by Time:

                              journalctl –since “YYYY-MM-DD HH:MM:SS” –until “YYYY-MM-DD HH:MM:SS”
                              journalctl –since “1 hour ago”

                              6. Filter by Priority:

                              journalctl -p [priority]

                              7. View Kernel Messages:

                              journalctl -k

                              8. Advanced Filtering:

                              journalctl -u nginx –since “2024-10-01” –until “2024-10-31” -p warning